Another Look at Child Poverty: The Supplemental Poverty Measure

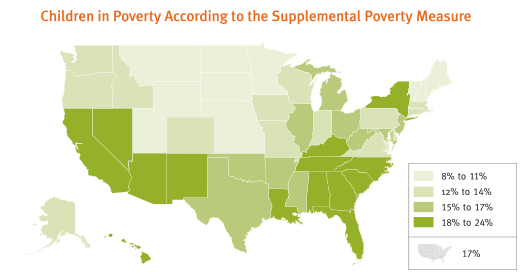
In the United States, 17% of children — 12.5 million kids total — are living in poverty, according to the Supplemental Poverty Measure.
This statistic varies widely by state: Child poverty rates are lowest in Minnesota (8%), Maine (9%) and Wyoming (9%) and highest in California (24%), Florida (22%) and Georgia (21%).
Unlike the official poverty measure — which sets the nation’s child poverty rate at 21% — the Supplemental Poverty Measure accounts for geographic variations when calculating cost of living. It also considers the impact of several important federal programs, such as the Earned Income Tax Credit and the Supplemental Nutrition Assistance Program (commonly called SNAP) as well as other influences on a family’s budget. As a result, the Supplemental Poverty Measure can paint a different — and more nuanced— picture of child poverty and help describe how social safety net programs and tax policies are affecting families.
Read a Data Snapshot about an earlier iteration of the Supplemental Poverty Measure
Visit the KIDS COUNT Data Center for more Economic Well-Being data at the national and state-level
Learn about children in poverty, as described by the Supplemental Poverty Measure