Child Poverty Declines After Peaking in 2011
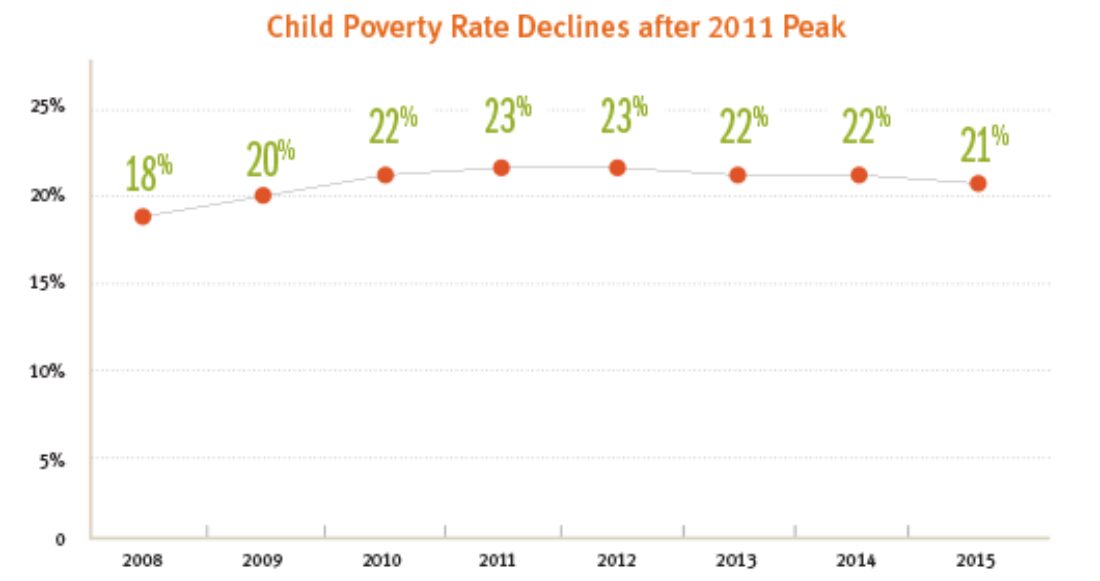
After the Great Recession, the nation’s child poverty rate increased steadily, peaking at 23% in 2011. Since then, the rate has been on a slow decline and, in 2015, reached its lowest level in five years, at which point one out of every five children lived in poverty. Although the child poverty rate in most states continues to be higher than before the recession, a large number of states have seen drops since the 2011 peak. Forty-three states and the District of Columbia saw their rates improve. Five states have maintained the same rate, and New Jersey and Delaware saw their rates increase.
Child poverty rates also dropped across all racial and ethnic categories. Even with these improvements, African American (36%), American Indian (34%) and Latino (31%) children are nearly three times as likely to live in poverty as white and Asian children.
States With the Largest Drops in Child Poverty Rates
|
STATE |
2011 |
2015 |
PERCENT |
|
North Dakota |
15% |
12% |
-20% * |
|
Utah |
16% |
13% |
-19% * |
|
Wyoming |
16% |
13% |
-19% |
|
Hawaii |
17% |
14% |
-18% * |
|
Colorado |
18% |
15% |
-17% * |
|
Oregon |
24% |
20% |
-17% * |
|
* Change is significant |
States With the Largest Increases in Child Poverty Rates
|
STATE |
2011 |
2015 |
PERCENT |
|
Delaware |
17% |
19% |
12% |
|
New Jersey |
15% |
16% |
7% |
|
* Change is significant |