New Interactive Map Tackles Debt in America Today
The Urban Institute has launched an interactive map that puts the pervasiveness of America’s modern debt epidemic on full display. The project, funded by the Annie E. Casey Foundation, integrates census data with millions of credit-bureau records.
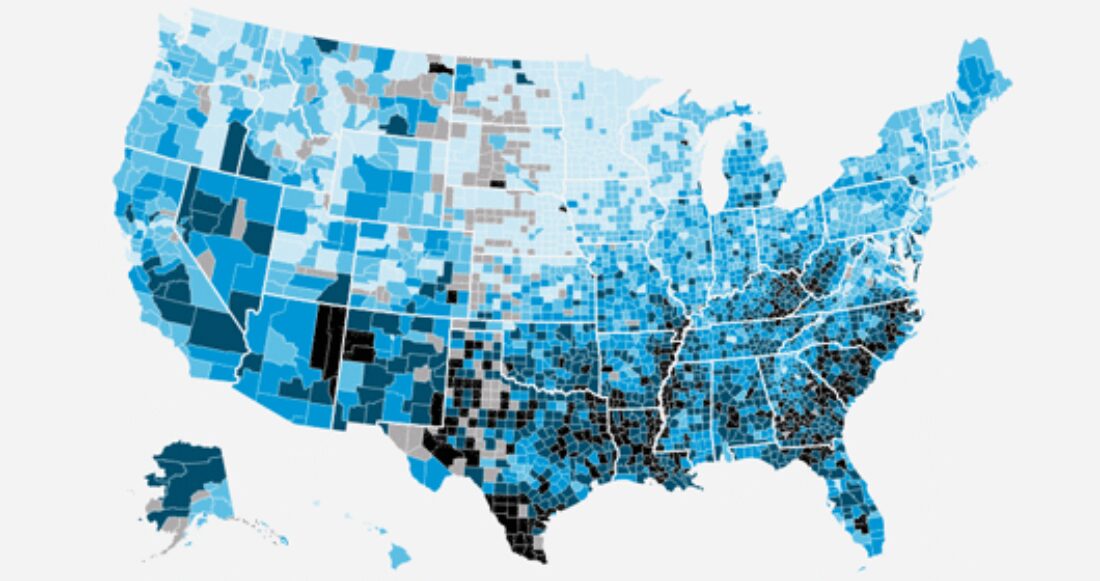
The tool’s main takeaway? While Americans struggle with household debt from coast to coast, residents in the South — especially residents of color — are much more likely to have debt in collections.
Visit the Debt in America Interactive Map
This finding is compelling but far from shocking. When compared to their white counterparts across the nation, people of color are much more likely to be in debt thanks to longstanding inequities, such as higher-than-average poverty rates and unfair lending practices.
“When we look at this map, we see a clear connection between race, place and financial instability,” says Don Baylor Jr., a senior associate at the Casey Foundation.
For example: The map indicates that 16% of white Americans and 21% of nonwhite Americans have medical debt, which is a major driver of financial instability and bankruptcy. Unpaid hospital fees are reported to the credit bureaus and can lower an individual’s credit score. The negative financial consequences domino from there — affecting everything from employment prospects to home purchasing power.
Connecting these dots — and then scrutinizing the connections — is important. “By examining the amount of debt folks have, what types and who’s carrying it, we can develop solutions to reduce these disparities and enable more families to save and build assets,” Baylor explains.
In fall 2017, the Casey Foundation awarded $580,000 in grants to seven partnerships focused on addressing the debt trap and lessening its impact on communities of color in the South. This cohort — called the Southern Partnership to Reduce Debt — will use the next 12 months to explore ways to tackle medical, court-related and high-cost consumer debt and develop strategies that support better financial outcomes for families of color.
One tool that’s sure to come in handy as these efforts advance is the Urban Institute’s interactive map. “It establishes a common dashboard for the Southern Partnership to Reduce Debt and other coalitions working to move families toward financial stability,” says Baylor. “We can use this data to develop solutions with policymakers, community leaders and employers—and to check back in on our progress.”
Future installments of the map will examine Americans’ indebtedness to the government, including public fees, fines and student loan debt.
Learn more about Casey’s Southern Partnership to Reduce Debt