How collecting and analyzing disaggregated race-based data can help leaders and communities effectively manage and allocate resources to help children and families.
How the Burns Institute uses race-based data to reduce disparities in juvenile detention.
How pairing data on race and ethnicity with GIS mapping software is helping create opportunities in communities lacking adequate resources.
Tips for advocating for better collection of data by race and ethnicity in your community.
This publication is the second installment in the Race for Results case study series. It features an inside look at how the W. Haywood Burns Institute and the Kirwan Institute for the Study of Race and Social Policy use disaggregated data on race and ethnicity to improve the lives of children and communities. These examples illustrate why the collection, analysis and use of race and ethnicity data should be an integral part of any strategy, initiative or legislative agenda affecting children, families and communities.
Disaggregating data by race and ethnicity improves outcomes for children and communities of color
Typically, public institutions and systems report data on whole populations. However, greater access to and breakdown of racial data helps to underscore racial trends and disparities more clearly and will provide greater accountability in policymaking.
Findings & Stats
Uncovering the Truth
Disaggregating data by race found that Latina youth were 46% of the Ventura County, CA, population, but made up 70% of detention center admissions.
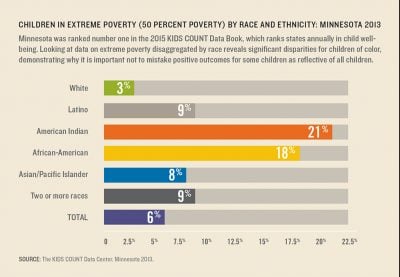
Color-Coded Disparities
Even in Minnesota — ranked number one in child well-being in the KIDS COUNT Data Book — disaggregated data by race revealed that while 3% of white kids were living in extreme poverty, up to 21% of American Indian and 18% of African-American kids were living in the same extreme poverty conditions.
A Geographic Perspective
Opportunity Mapping in Columbus, Ohio, revealed that areas with no infant deaths were adjacent to neighborhoods of color with infant death rates as high as those in Central America.
Statements & Quotations
If you never collect data, you’ll never know the specifics of the problem.
– James Bell, W. Haywood Burns Institute
Kirwan’s Opportunity Mapping process gathers and disaggregates data on education, health, housing, jobs, transportation and child care. Kirwan then overlays these indicators of opportunity onto maps.
Subscribe to our newsletter to get our data, reports and news in your inbox.