Housing Decline in San Francisco
After increasing at an unprecedented annual rate of almost 10% from 2000 to 2006, the housing price index for San Francisco/Oakland had one of the sharpest declines from 2006 to 2010, over 10% per year.
Community planners recognize that conditions in their metropolitan areas have a powerful influence on what they can accomplish at the neighborhood level. This report highlights the 14 metros that were the focus for investment by the Annie E. Casey Foundation in the 2000s. These 14 represent the diversity across America’s large metropolitan areas. The report is organized into three sections. Section 1 introduces the 14 Casey metros using background indicators (e.g., on demographic conditions, social conditions and poverty levels). Section 2 examines the dynamics of the economies of these metropolitan areas since 2000, and Section 3 does the same for their housing markets.
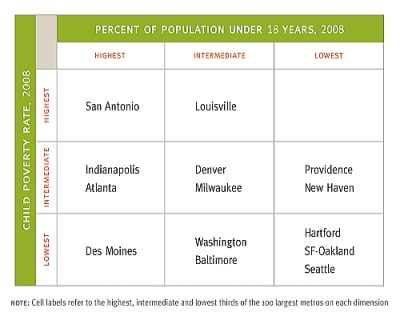
The 100 top metro cities were divided into thirds according to their child poverty rates and the share of their population that was under 18 (in 2008). Casey metros are found in all cells of the matrix but one, and can be considered reasonably representative of the diversity of the 100 metros (for these factors) in reviewing the rest of this report.
We hope you'll find value in this report. We’d love to get a little information from you, which we'll use to notify you about relevant new resources.