National trends in child well-being, comparing how children were faring in 2007/2008 to 2000.
State rankings on overall child well-being and 10 individual indicators.
Data on how child well-being varies by race/ethnicity.
Recommendations on how to improve federal data collection on child well-being.
Information about how to access national and state profiles and additional data on child well-being at the KIDS COUNT Data Center, datacenter.aecf.org.
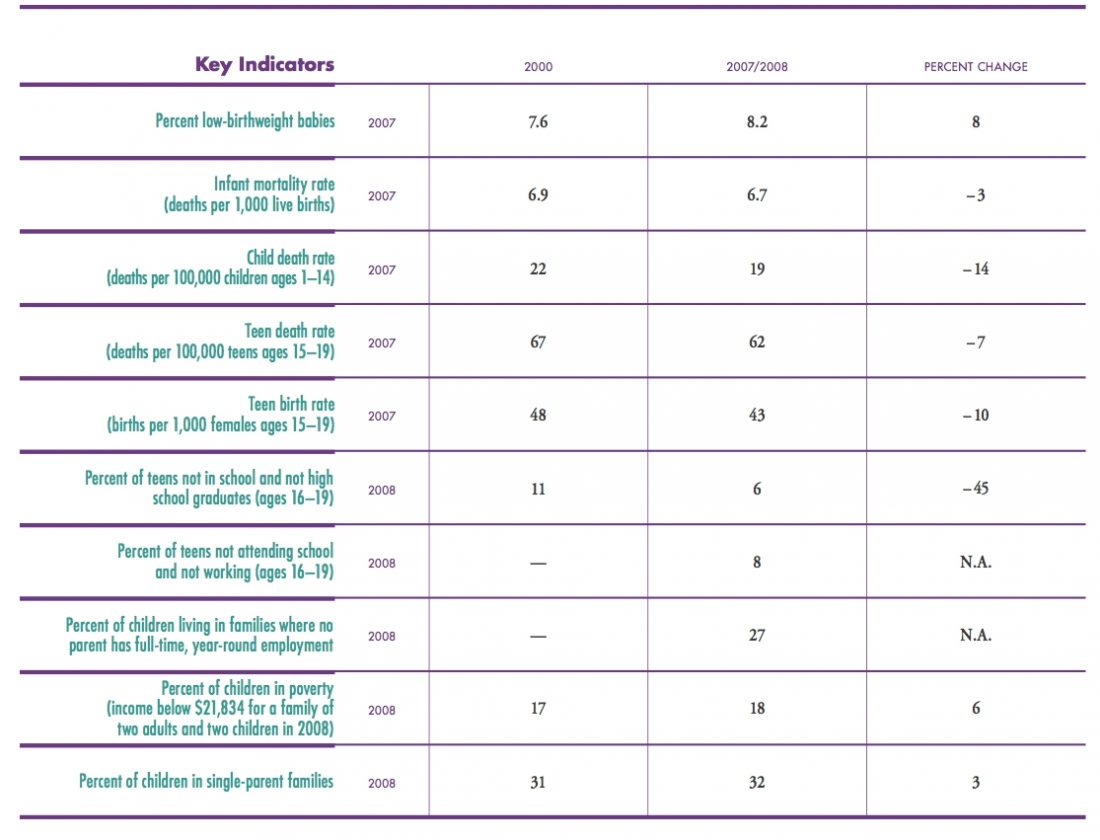
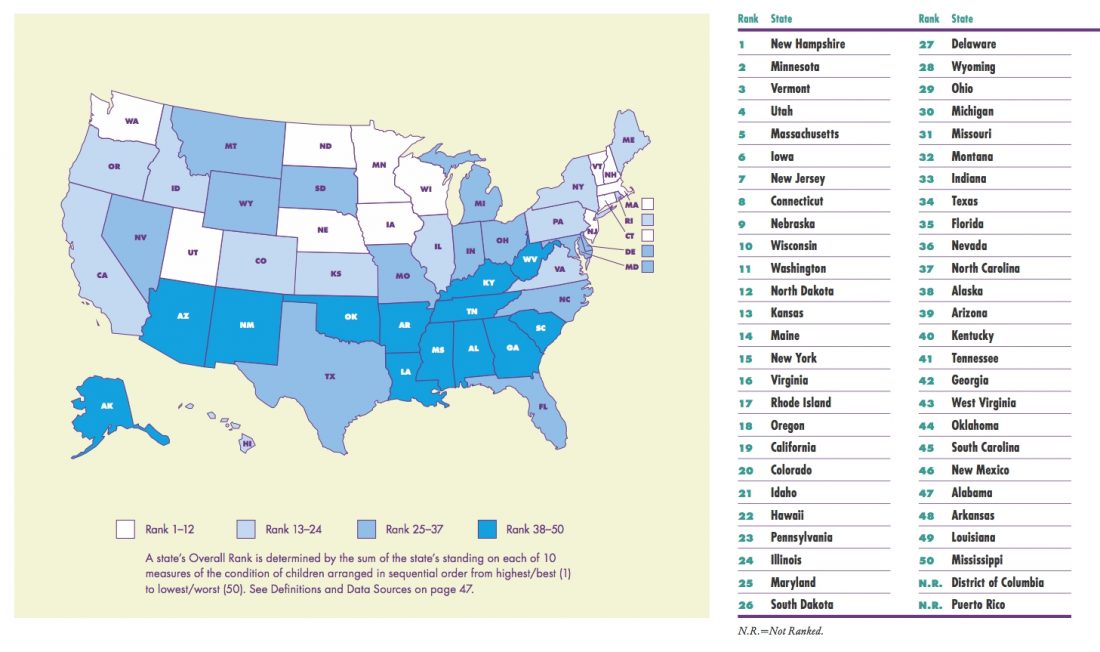
The KIDS COUNT Data Book is an annual publication that assesses child well-being nationally and across the 50 states. The 2010 report ranks states on 10 indicators that reflect a wide range of factors affecting the well-being of children, particularly health, adequacy of income, and educational attainment. Based on a composite index of the 10 indicators, the three highest ranked states for child-being overall were New Hampshire, Minnesota and Vermont; the three lowest ranked states were Mississippi, Louisiana and Arkansas. At the national level, child well-being stagnated since 2000 after improving in the late 1990s. Due to time lags in data availability, this report relies primarily on data collected in 2007 and 2008, with some of the measures reflecting what happened in the prior year. Therefore the findings do not capture the effects of the economic downturn on families and children, which were largely felt well into 2008 and in 2009.
The child poverty rate rose from 17% to 18%, representing an increase of one million children.
In the years prior to 2000, child poverty fell substantially, representing the largest drop since the 1960s. But then improvement stalled: between 2000 and 2008, the child poverty rate rose from 17% to 18%, representing an increase of one million children. The percent of children living in single-parent families increased slightly over the same period. From 2000 to 2007/8, children made gains in the area of health and safety—the mortality rate declined across three age groups of children—but the percent of low-birthweight babies increased.
Findings & Stats
Improvement for Teens
Teenagers showed positive improvement in two areas. From 2000 to 2007, the teen birth rate dropped by 10%, and from 2000 to 2008, the percent of teens ages 16 to 19 who were not in school but yet had not graduated declined from 11% to 6%.
Racial Inequities Persist
Since 2000, inequities in child well-being along racial and ethnic lines have decreased in some areas—most notably, the high school drop-out rate. On the whole, however, non-Hispanic white children continue to have much greater opportunities for positive outcomes.
Northern States Fare Well
Eight of the 10 most highly ranked states on overall child well-being are located in New England (New Hampshire, Vermont, Massachusetts and Connecticut) or in the Northern Plains (Minnesota, Iowa, Nebraska and Wisconsin).
Southern States Lag Behind
At the other end of the spectrum, the 10 states with the lowest rank for overall child well-being are in the Southeast and the Southwest.
10 key indicators of child well-being, nationanal average: 2000 and 2007/2008
Kids Count overall rank: 2010
Statements & Quotations
Our KIDS COUNT Data Book has made significant strides in tracking results and compiling data on children and families during the past two decades..... But we can only go so far without improvements to our national and state data collection systems. At the Casey Foundation, we believe that calculating child well-being should be a national priority, as widely discussed and distributed as the monthly data on unemployment or housing starts.
The portrait of change in child well-being since 2000 stands in stark contrast to the period just prior to 2000. Between 1996 and 2000, 8 of the 10 key indicators used in KIDS COUNT improved, and several improved dramatically. The improvement was experienced by every major racial group and in nearly all of the states.
Subscribe to our newsletter to get our data, reports and news in your inbox.