Youth Confinement Rates Were Down
Closely tracking with the drop of youth arrests, youth confinement rates were down 77% from 1995 to 2023.
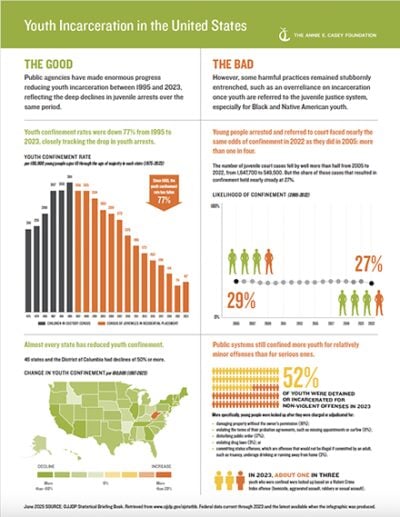
An infographic from the Annie E. Casey Foundation presents positive and negative trends in youth incarceration between 1995 and 2023 and recommendations for more effective responses than incarceration when young people break the law. It is based on federal data, which is current through 2023 and the latest available.
Juvenile justice agencies have made enormous progress by reducing youth incarceration 77% between 1995 and 2023, reflecting the deep declines in juvenile arrests over the same period. However, some harmful practices remained stubbornly entrenched in 2019, such as an overreliance on incarceration once youth were referred to the juvenile justice system, especially for Black and Native American youth.
The infographic disaggregates data by race and ethnicity because the large reduction in the overall number of young people behind bars obscures a sobering reality: Black youth are 21 times as likely to be in custody as their Asian and Pacific Islander peers, six times as likely as white peers and five times as likely as Hispanic peers.
The side-by-side format of the infographic identifies trends to celebrate as well as areas of concern. It concludes by addressing those concerns with recommendations for more effective responses than incarceration when young people break the law.
The infographic doesn’t include youth incarcerated in the adult criminal justice system. On a typical day in 2022, as per the latest federal data, 2,400 youth under age 18 were held in adult jails and prisons.
Public agencies have reduced youth incarceration by 77% between 1995 and 2023, reflecting the deep declines in juvenile arrests over the same period, according to recently released federal data, which is current through 2023 and the latest available. However, some harmful practices remained stubbornly entrenched in 2023, such as an overreliance on incarceration once youth were referred to the juvenile justice system, especially for Black and Native American youth.
An infographic based on federal data presents key positive and negative trends in youth incarceration over the last three decades. The side-by-side format identifies trends to celebrate as well as areas of concern. It concludes by addressing those concerns with recommendations for more effective responses than incarceration when young people break the law.
We hope you'll find value in this report. We’d love to get a little information from you, which we'll use to notify you about relevant new resources.