2022 High School Graduation Rate Improves for the First Time Since 2019

The latest data from the 2021–2022 school year show that the nation reached a historic high of 87% of high school students graduating on time, after holding steady at 86% since 2018–2019. This is a noteworthy achievement as students across the country continue to recover from pandemic disruptions in education and daily life.
High school graduation rates are a key indicator of youth well-being. Students who graduate from high school are more likely to pursue postsecondary education and training and have better long-term employment and health prospects than those who do not graduate.
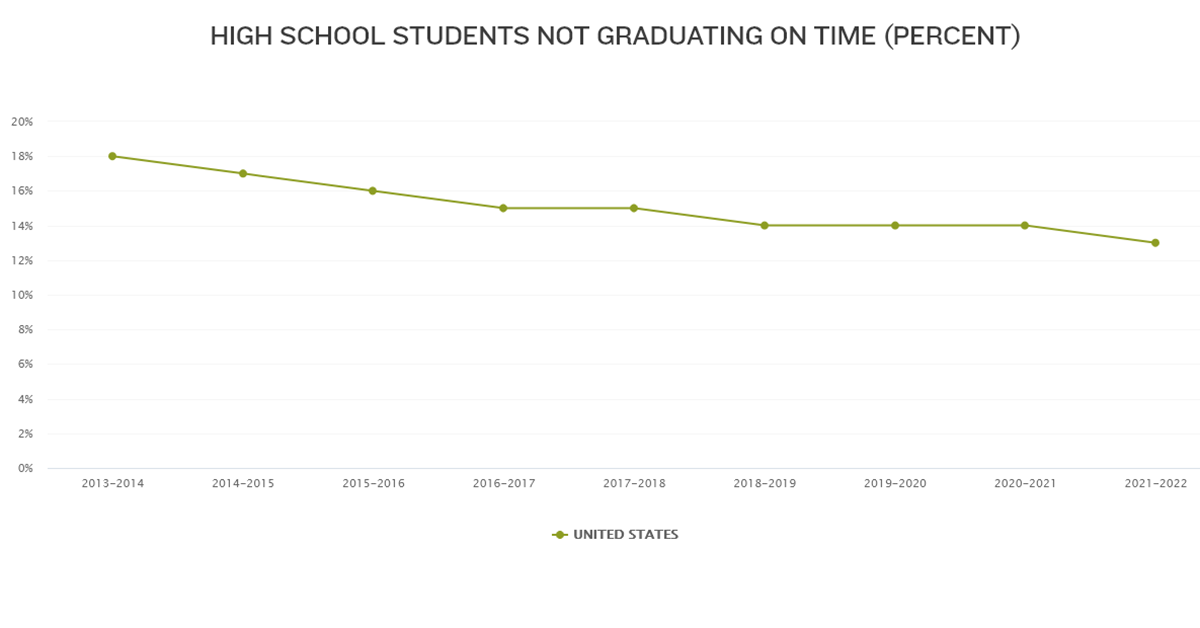
U.S. graduation rates have been steadily improving for years. Specifically, newly updated data from the KIDS COUNT Data Center show that 13% of U.S. high school students did not graduate on time in 2021–2022 — an improvement of 5 percentage points from 2013–2014, the earliest year available.
All Racial and Ethnic Groups Made High School Graduation Gains in the Last Decade
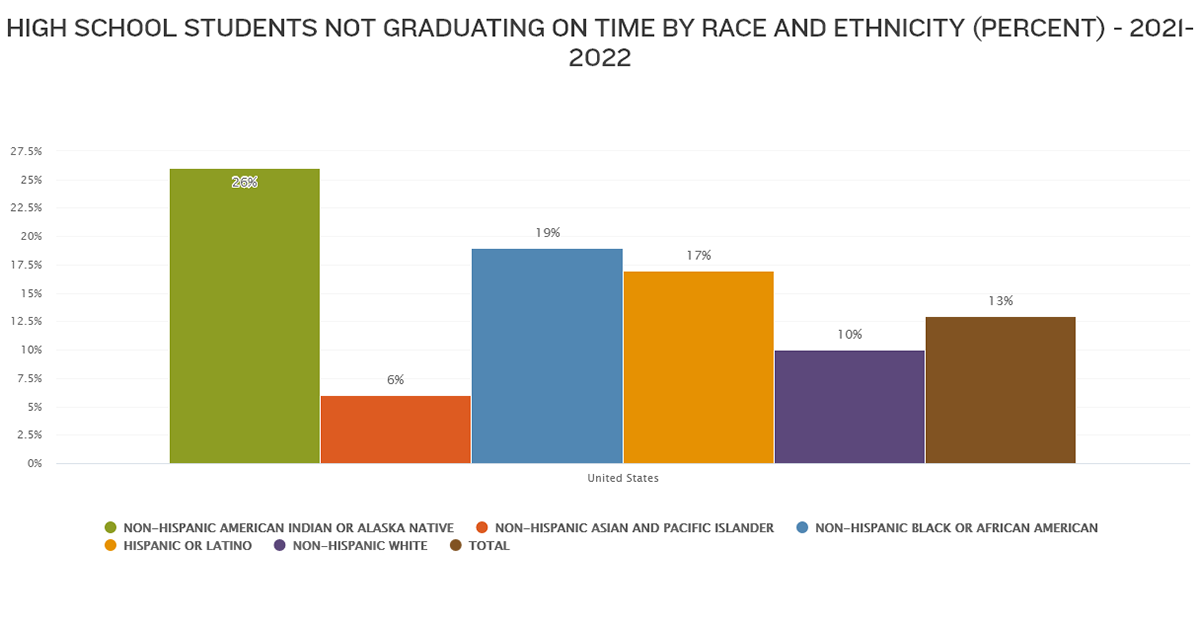
Timely graduation rates improved for all racial and ethnic groups from 2013–2014 to 2021–2022, with some demonstrating substantial progress. However, racial inequities in educational opportunities and outcomes remain a serious problem, and disparities in graduation rates have not narrowed over the last nine years.
Key trends by racial and ethnic group:
- American Indian and Alaska Native students: Almost three in four (74%) graduated on time in 2021–22, the same figure as the previous year and a 4‑percentage-point improvement over 2013–2014. Despite this progress, American Indian and Alaska Native students still face more hurdles to on-time graduation than their peers of other racial and ethnic backgrounds.
- Black students: Over four in five (81%) achieved timely graduation in 2021–2022, up by 1 percentage point from 2020–2021 and 9 percentage points over 2013–2014.This was the largest improvement of any racial or ethnic group in this period.
- Latino students: Similarly, rates increased from 82% to 83% in 2021–2022, and they rose by 7 percentage points since 2013–2014.
- White students: Timely graduation rates held steady at 90% in 2021–2022 and increased by 3 percentage points since 2013–2014.
- Asian and Pacific Islander students: Rates improved from 93% to 94% in 2021–2022, representing a 5‑percentage-point jump from eight years ago. However, when education data are disaggregated by specific Asian American and Native Hawaiian and Pacific Islander groups, large disparities emerge as these are widely heterogeneous populations.
High School Graduation Rates Also Vary at the State Level
In 2021–2022, rates ranged from just over three-quarters of students graduating on time in New Mexico (76%) and Arizona (77%) to more than nine in ten (91%) in West Virginia. Eighteen states exceeded the national rate (87%) that year. Looking at progress since 2013–2014, the vast majority of states and D.C. demonstrated improvements over this timeframe, although just 17 states and D.C. made gains from 2020–2021 to 2021–2022.
Future Outlook on Graduation Rates
The COVID-19 pandemic led to school closures, virtual instruction and increased social isolation, causing concerns about student learning loss and declines in school connection. While some indicators bear out these concerns with drops in student reading and math proficiency, and a spike in chronic absenteeism, 2022 high school graduation rates signal promising signs of early pandemic recovery. Data by race and ethnicity, though, show enduring educational inequities for students of color, particularly for American Indian or Alaska Native students. To address inequities and ensure a full recovery from the pandemic, schools and communities can strengthen partnerships on comprehensive approaches to support student success, especially for vulnerable students. This includes bolstering systems in and outside of schools to address diverse student needs, from education and family needs to emotional and physical health issues.
Access More Information Related to High School Graduation
- Preparing High School Students for Careers During and After the Pandemic, 2023
- Explore the Foundation’s educational resources
- See all education data on the KIDS COUNT Data Center
- Visit Johns Hopkins University’s Everyone Graduates Center
High school graduation rates are also tracked in the KIDS COUNT Index, which is reported annually in the KIDS COUNT Data Book.
Sign up for our newsletters to get the latest reports and resources