A Decade of Data: Kids in High-Poverty Communities
Posted March 9, 2017
By the Annie E. Casey Foundation

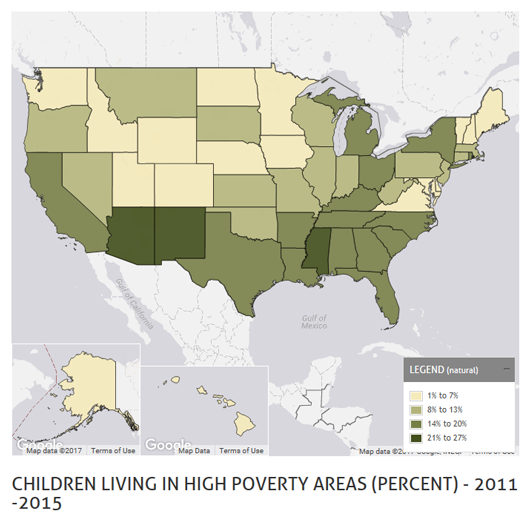
Across the country, 14% of children are now living in high-poverty communities, according to the KIDS COUNT Data Center. Casey defines concentrated poverty as neighborhoods (census tracts) with poverty rates of 30% or more, though research shows that residents start to experience limited opportunities when the poverty rate reaches 20%.
When researchers compared this rate across two time periods — 2006 to 2010 and 2011 to 2015 — they found that:
- The incidence of children living in areas of concentrated poverty nationwide has increased by nearly 30% —from 7.9 million kids to 10.0 million kids.
- In 42 states, children were more likely to live in high-poverty areas.
- Nevada saw the largest state-level rate increase. There, the rate of children living in high-poverty neighborhoods increased by 117%, from 6% to 13%.
- In 38 of the nation’s 50 largest cities, children were more likely to live in high-poverty communities.
- Mesa saw the largest city-level rate increase. There, the rate of children living in high-poverty areas jumped by 200%, from 5% to 15%.
- Black and American Indian children are now six times more likely to live in neighborhoods with limited resources compared to their white peers.
Find more family and community data — at the local, state and national level — in the KIDS COUNT Data Center.