



New Child Poverty Data Reinforce the Powerful Impact of Economic Policies on Reducing Child Poverty

Public support programs, such as refundable tax credits, kept 7.5 million kids out of poverty in 2025
The U.S. Census Bureau recently released the updated 2025 measures of poverty from the Current Population Survey Annual Social and Economic Supplement (CPS ASEC): the official poverty measure and the Supplemental Poverty Measure (SPM).
In 2025, the official poverty threshold was $32,649 for a family of two adults and two children. Families can earn well over this amount and still not make ends meet, especially in high-cost areas. Unlike the official poverty measure, the SPM factors in regional variation in cost of living as well as major family expenses and multiple types of income, including public assistance. For these reasons, the SPM is more comprehensive and better reflects today’s realities.
How Poverty Affects Children
Growing up in poverty is one of the greatest threats to healthy child development. The effects of economic hardship, particularly deep and persistent poverty, can disrupt children’s cognitive development, physical and mental health, educational success and other aspects of life. These effects reverberate throughout adulthood. Researchers estimate the total U.S. cost of child poverty up to $1.1 trillion per year based on lost productivity and increased healthcare, public programs and other expenditures.
While the SPM child poverty rate was stable in 2025, it still means the health and well-being of millions of children remain at risk. Kids need security and stability. Decisions by policymakers today will have lasting impacts on young people’s lives — impacts that will affect our country’s future workforce, economy, elections and more.
What Is the Main Cause of Child Poverty?
Child poverty is connected to family poverty. While there is no single cause of poverty, families may fall into financial hardship due to a job loss, expenses that become too high — such as housing, healthcare and groceries — a transition from a two-parent to a single-parent household or another destabilizing event. Among children and families of color, the picture is further complicated by generations-long disparities and unequal access to economic opportunities and resources.
Neighborhoods matter, too. Communities with concentrated poverty, which are often racially segregated, tend to have fewer job opportunities for parents and youth, underfunded schools and fewer resources in general. When children grow up in these neighborhoods, it can take generations to move out of poverty.
Additionally, larger economic forces, labor markets and public policies affect child poverty. For instance, parental unemployment and child poverty increase during economic recessions, and labor market factors — such as minimum wage levels — affect poverty rates.
Demographics play a role as well, with older, more educated parents generally able to obtain higher wages. Child poverty rates are also affected by the strength of government support programs, such as the extended child tax credit discussed below.
Where Are Child Poverty Rates Highest in the United States?
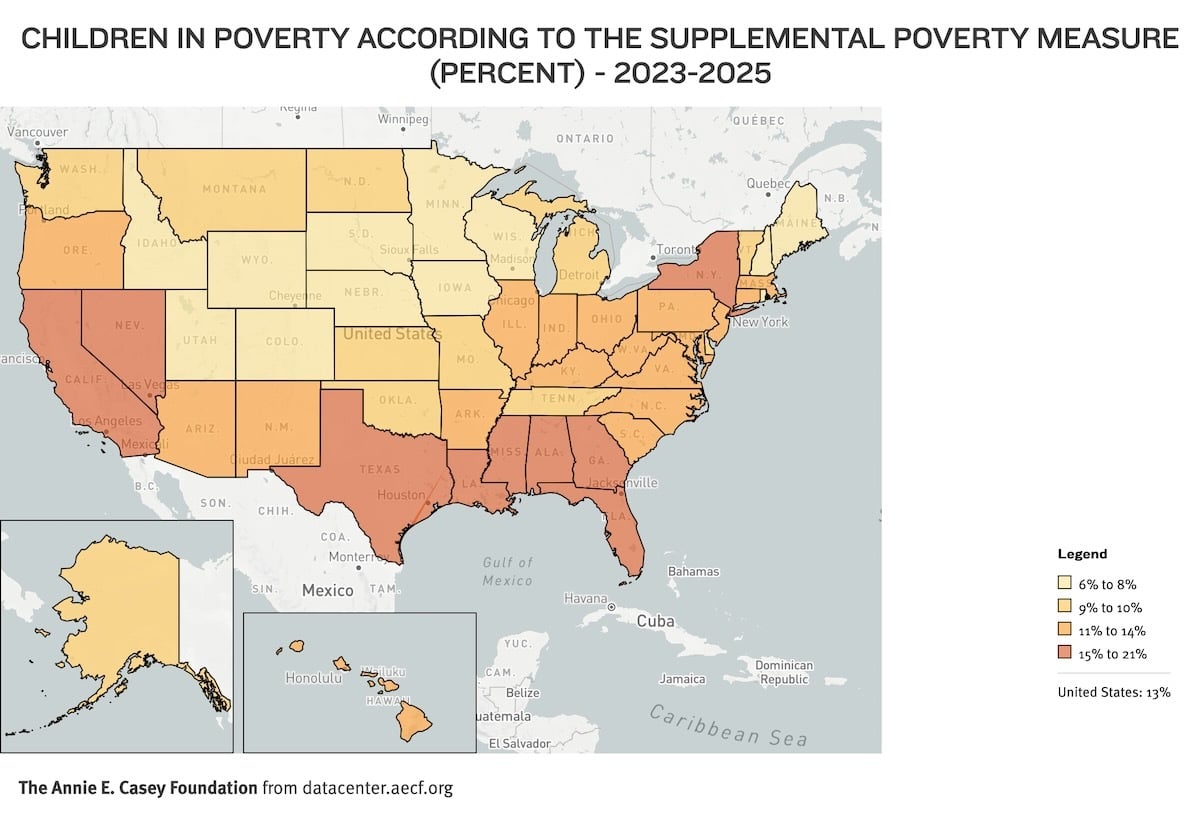
Every state in America has children living in poverty, but higher rates generally exist in the southern region of the country (see map below) as well as in rural areas and urban neighborhoods of concentrated poverty. For example, a 2026 study in the Journal of Rural Health found that almost one-fourth (24%) of children in rural areas live below the federal poverty level, and the same was true for nearly one-fifth (18%) of kids in urban areas.
According to 2023–2025 SPM child poverty rates on the KIDS COUNT® Data Center:
- Louisiana, the District of Columbia and Mississippi had the highest rates in the country, with about 1 in 5 kids living in poverty — 21%, 20% and 19%, respectively — followed by California and Florida, both with 18%.
- Idaho and Wyoming had the lowest rates in the nation, at 6%. Maine, Minnesota, Nebraska, Utah and Wisconsin were close behind, tied at 7%.
- Between 2020–2022 and 2023–2025, child poverty rates increased in all states and the District of Columbia except in Alaska and Wyoming, where rates remained even.
How Do U.S. Child Poverty Rates Vary by Race and Ethnicity?
For decades, children and families of color have borne a disproportionate burden of poverty in the United States, and the latest SPM poverty estimates show a continuation of this pattern. However, between 2024 and 2025, the SPM child poverty rate improved for four of six racial and ethnic groups with available data:
- Black children: Although this group had the highest rate in 2025, with more than 1 in 5 (22%) living in poverty, the rate improved slightly from 23% in 2024.
- Latino children: The poverty rate for these kids also declined by one percentage point, from 21% to 20% in this timeframe.
- American Indian or Alaska Native children: The rate for this group improved by three percentage points, from 15% to 12% in the latest year.
- Multiracial children: Here, too, poverty fell three points, from 14% to 11%.
- Asian and Pacific Islander children: The rate increased from 10% to 11% for these kids. Note that combining Asian and Pacific Islander groups can conceal disparities, and disaggregated data have demonstrated large socioeconomic differences among these populations.
- White children: This group consistently has the lowest poverty rate, at 8% in 2025, although it inched up from 7% the previous year.
When Will the 2025 Single-Year State Child Poverty Rates Be Available?
The Census Bureau has delayed the release of the 2025 American Community Survey poverty data, and an exact release date has not yet been determined. The Bureau typically releases new SPM data from the CPS ASEC and poverty estimates from the ACS in mid-September. This year, however, the ACS is delayed due to new requirements for protecting data confidentiality. This delay matters because the ACS provides the large sample needed to reliably measure poverty at the state and local levels and by race and ethnicity, age and other factors. These updated data are essential for understanding where poverty is concentrated and which children and families are most affected.
The following official poverty indicators will be updated on the KIDS COUNT Data Center when 2025 estimates become available:
- Children in poverty
- Children in poverty, by race and ethnicity
- Children in poverty, by race and ethnicity and age group
Which Policies Reduce Child Poverty?
The SPM continues to show that key public programs — particularly the refundable child tax credit — are among the most effective ways to lower child poverty.
The Foundation’s recent SPM data snapshot, Measuring Access to Opportunity in the United States, found that the refundable child tax credit, earned income tax credit, Supplemental Nutrition Assistance Program (SNAP), housing subsidies, Social Security and SSI each reduced child poverty by several percentage points in recent years, helping families cover food, housing and other essentials. States that expanded or created their own tax credits achieved additional substantial reductions in child poverty. The snapshot also revealed that during 2022–2024, federal and state policies together lowered SPM child poverty by at least 10 percentage points in 34 states and the District of Columbia.
Pandemic-era relief measures provided particularly striking evidence that these public investments work. In 2021, the SPM showed that the expanded child tax credit alone moved about 3 million children out of poverty. This federal child tax credit, together with other government supports, successfully cut the child poverty rate in half, to an historic low of 5% in 2021. Without the child tax credit, the rate would have been almost twice as high that year.
By 2024, as relief measures expired, the SPM child poverty rate nearly tripled to 13% — without any public support, it would have reached 25%.
The latest Census data reinforce and expand on this evidence: new SPM data show that without these key public programs, the child poverty rate would have been 24% rather than 13% in 2025. Public supports like the child tax credit lifted approximately 7.5 million kids out of poverty in 2025.
What the Latest Child Poverty Data Mean
These findings demonstrate that real progress is possible. Dramatically reducing child poverty in America is an achievable policy goal. Millions of children can be kept out of poverty with supportive public policies, such as refundable child tax credits, SNAP and Social Security.
Strong economic support programs are essential to ensuring that all children have access to the opportunities and resources they need to thrive.
Explore More Child and Family Poverty Resources
- Economic Well-being Indicators on the KIDS COUNT Data Center
- 2026 KIDS COUNT Data Book
- Measuring Access to Opportunity in the United States: A 10-Year Update
- Most Common Uses of 2021 Child Tax Credit Payments: Food, Utilities, Housing, Clothes
- Communities With Limited Food Access in the United States
- Child Food Insecurity in America
- Child Poverty: Resources
- Expanding Opportunity for All: Resources
- Economic Opportunity: Resources
Get the latest data, reports and resources from the Casey Foundation