What is the Supplemental Child Poverty Rate in Your State?
To better understand how families are faring, the U.S. Census Bureau created the Supplemental Poverty Measure (SPM) in 2011, basing it on decades of research. The SPM measures the impact of a number of important social programs such as SNAP and the Earned Income Tax Credit (EITC) and accounts for rising costs and other changes that affect a family’s budget. Unlike the official poverty measure, the SPM is adjusted for geographic variations in the cost of living.
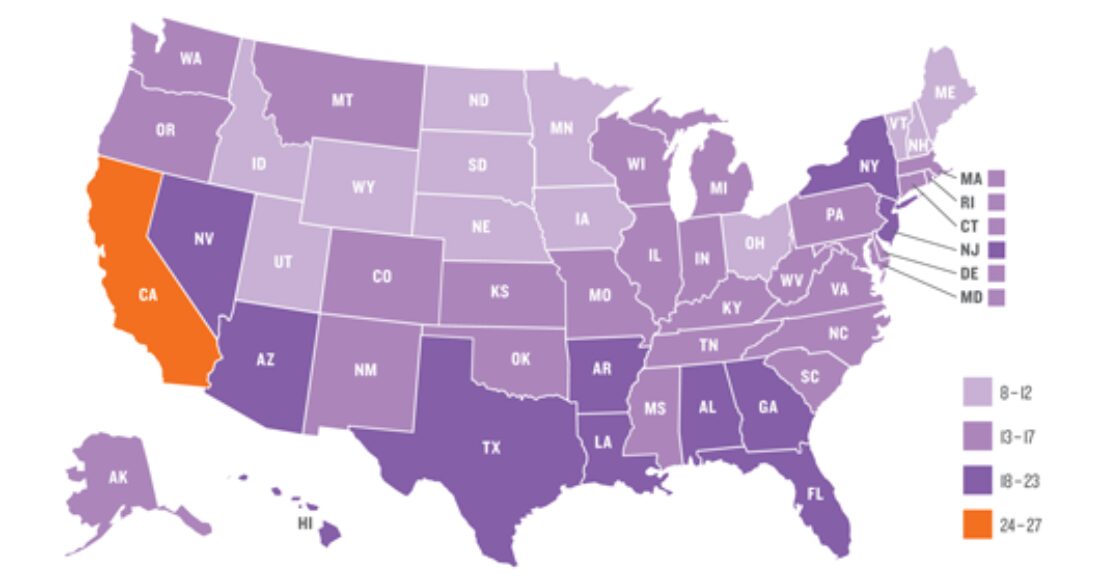
The child poverty rates by state vary dramatically using the SPM, according to Measuring Access to Oppportunity in the United States, a new KIDS COUNT data snapshot. Regional patterns differ from the traditional poverty measure. Using the SPM, California has the highest child poverty rate among states, followed by Arizona and Nevada. States with some of the largest child populations, like Florida, New York and Texas, have among the high- est child poverty rates, using the SPM. The lowest rates are in the upper Midwest and northern New England.