Understanding the Children of Immigrant Families

In recent years, children in immigrant families regularly have been at the center of public policy discussions, such as those regarding the southern border of the United States and the Deferred Action for Childhood Arrivals policy, among others. To promote an accurate understanding of this population and constructive conversations about how to support these children and their families, it is important to understand basic terminology and key facts about this group in the United States.
Definitions About Children in Immigrant Families
Immigrant or Foreign-born
The terms immigrant and foreign-born are interchangeable and refer to individuals who were not U.S. citizens at birth but may have become citizens through naturalization. Those who are not citizens may include lawful permanent residents, those with temporary visas, refugees and asylum seekers or undocumented immigrants.
U.S. Citizens
Citizenship usually is acquired when a child is born in the United States, Puerto Rico, Guam, the U.S. Virgin Islands or the Northern Marianas or born abroad to American parents. Citizenship also can be obtained through the naturalization process.
Naturalization
This is the process in which a lawful permanent resident becomes a U.S. citizen after meeting requirements in the Immigration and Nationality Act.
Kids under age 18 can become naturalized citizens if at least one parent naturalizes or if they are adopted by a U.S. citizen parent. Adults generally can qualify for naturalization after being a permanent resident for at least five years, or three years if married to a U.S. citizen, along with meeting other specific criteria. Individuals can also qualify based on military service. Many parents are eligible to naturalize and may need support to take the steps to become a U.S. citizen, which could help their families access important public services, legal rights, new job opportunities and other benefits.
Lawful Permanent Residents (also known as “green card” holders)
This permanent status may be obtained through multiple methods, including family relationships, employment sponsorships, humanitarian protection (for refugees and asylum seekers) or the Diversity Visa Program lottery.
Asylum Seekers and Refugees
These are individuals who need protection due to persecution or fear of persecution “on account of race, religion, nationality and/or membership in a particular social group or political opinion.” Asylum seekers submit applications at a port of entry to the United States or when they are already in the country, while refugees are usually outside of the United States when they are considered for resettlement.
Undocumented Immigrants
This term refers to foreign-born individuals who are not citizens and not legal residents. This includes people who entered the United States without inspection and those who were legally admitted on a temporary basis but stayed beyond their required departure date.
Migrants
Generally, “migrants” refers to people who changed their country of usual residence regardless of the reason. It may be voluntary or forced migration, and it may be temporary or permanent.
Nativity
Nativity refers to whether individuals are native-born versus foreign-born. Native-born is defined as born in the United States, Puerto Rico, Guam, the U.S. Virgin Islands or the Northern Marianas or born abroad to American parents.
First-generation Immigrant Children
This term typically refers to foreign-born children with at least one foreign-born parent.
Second-generation Immigrant Children
This term typically refers to native-born children with at least one foreign-born parent.
Children in Immigrant Families
Generally, this term includes both first- and second-generation immigrant children.
How Many Children Are in Immigrant Families in the United States?
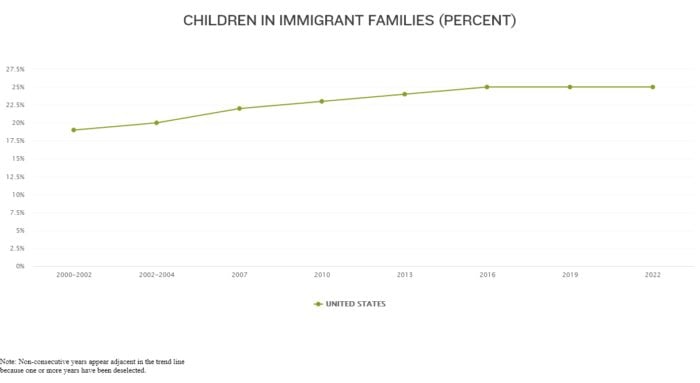
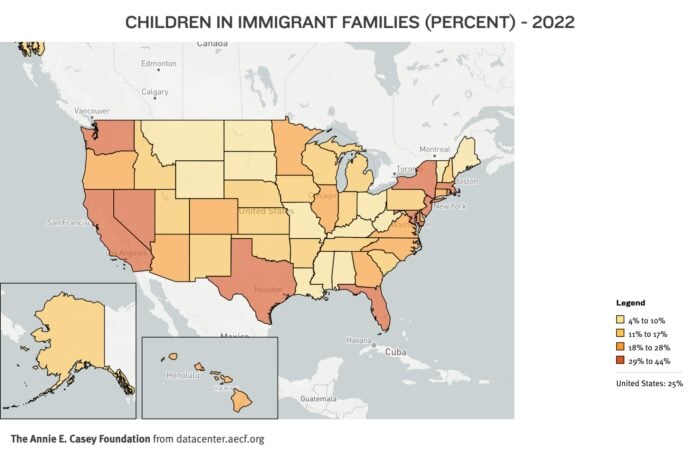
One in 4 children (25%) — or 18 million kids — were in immigrant families in 2022, up from 1 in 5 (19%) in the early 2000s. The share of children in immigrant families also increased in all but three states, and it at least doubled in 16 states, over this time period.
While this population has grown considerably during the last 20 or more years, births to foreign-born mothers have not mirrored this increase. In 2021 (latest data available on the KIDS COUNT® Data Center), 21% of births were to foreign-born women, the same share as in 2000. This percentage rose to 25% in 2006 but has since dropped back down to its previous level.
How many youth and young adults are immigrants or live in immigrant families in the United States?
About 10.5 million, or 22%, of young people ages 14 to 24 were foreign-born or lived with at least one foreign-born parent in 2017–2021. This population has grown from 9.6 million, or 20%, in 2006–2010.
What states have the largest share of children of immigrant families?
Seven states consistently have ranked at the top in recent years, with the biggest shares in the country: California (44% in 2022), New Jersey (41%), New York (36%), Florida (34%), Massachusetts and Nevada (both 33%) and Texas (32%). Half of the nation’s 18 million children of immigrant families reside in just four of these states: California (3.7 million in 2022), Texas (2.4 million), Florida (1.5 million) and New York (1.4 million).
View all state-level data on children in immigrant families
What states have the largest share of these youth and young adults?
Similar to the patterns for kids, states with the highest percentages of older youth ages 14 to 24 who are immigrants or live with at least one immigrant parent include California (44% in 2017–2021), Nevada and New Jersey (both 34%), New York (32%), Florida (31%) and Texas (30%). These six states have had the highest shares of youth and young adults in immigrant households for all years available on the KIDS COUNT Data Center.
More than half (53%) of these 10.5 million young people live in the same four states noted for children above: California, Texas, New York and Florida.
What parts of the country have seen the greatest increase in shares of children and youth of immigrant families?
Overall, five states experienced the biggest rise in shares of children, youth and young adults in immigrant families during the past 15 to 20 years: Maryland, Massachusetts, New Jersey, Virginia and Washington. Specific findings by age group and state are provided below.
Children under age 18
Over the last two decades, the following states and D.C. — all but one located in the Eastern region of the United States — experienced the largest increase in children of immigrant families, with jumps of 10 to 17 percentage points:
- Maryland: from 15% in 2000–2002 to 32% in 2022
- New Jersey: 27% to 41%
- Massachusetts: 20% to 33%
- Washington: 18% to 30%
- Delaware: 9% to 21%
- District of Columbia: 17% to 28%
- Virginia: 13% to 24%
- Georgia: 10% to 21%
- North Carolina: 9% to 19%
Young people ages 14 to 24
During the 15-year span in which data are available for youth and young adults in immigrant households, the following states saw the most growth in shares of this population, with upticks of 4 to 5 percentage points:
- Massachusetts: from 20% in 2006–2010 to 25% in 2017–2021
- Maryland: 19% to 24%
- New Jersey: 30% to 34%
- Washington: 20% to 24%
- Virginia: 15% to 19%
- Minnesota: 12% to 16%
- Pennsylvania: 8% to 12%
- Vermont: 5% to 9%
How do states vary by children of immigrants’ parental regions of origin?
As national context, the majority of U.S. children in immigrant families have parents originating from Latin America, although this share has declined from 62% in 2005 to 57% in 2022. The share with parents from Asia, on the other hand, has increased from 22% to 25% in the same time period. The percentage with parents from Africa rose as well, from 4% to 8%. Children of immigrants with parents from Europe declined slightly, from 10% to 9%, during this timeframe.
Parent region of origin: Latin America
At the state level in 2022, children in immigrant families with parents originating from Latin America were most likely to live in the following western and southern states, among those with available data:
- New Mexico: 81%
- Florida: 78%
- Arizona: 72%
- Arkansas: 72%
- Texas: 71%
- Oklahoma: 70%
However, these states are not where most of the growth occurred in the past couple decades. Texas has actually experienced the biggest decrease in shares of this population of any state, with a drop of 10 percentage points between 2005 and 2022, and Arizona had a drop of 9 percentage points in this period. New Mexico and Arkansas also saw small declines of 4 and 2 points, respectively. The greatest growth in shares of this population occurred in five other states since the mid-2000s:
- Tennessee: from 44% in 2005 to 56% in 2022
- Connecticut: 40% to 52%
- Wisconsin: 41% to 52%
- South Carolina: 51% to 61%
- Pennsylvania: 31% to 41%
Parent region of origin: Asia
Hawaii and Michigan by far have the largest shares of kids in immigrant families with parents originating from Asia, at 64% and 54% in 2022, respectively. The next highest shares were in Washington and Virginia in 2022, with 35%.
While Hawaii and Michigan consistently have the greatest shares of this population, these states are experiencing opposite trends over time. Between 2005 and 2022, Hawaii had the second-largest decline in this population nationwide, with a drop of 9 percentage points (Louisiana had the biggest drop in the country, from 37% to 22%). Michigan, conversely, saw the most growth in shares of this population of any state in the last 17 years, with a 9 percentage point jump between 2005 and 2022. Five states followed Michigan’s upward trajectory, with increases of 6 to 8 percentage points: Idaho and Arizona (both rose from 9% to 17%), California (25% to 32%), Oregon (21% to 27%) and Texas (12% to 18%).
Parent region of origin: Africa
Minnesota, Ohio and Maryland consistently have the greatest percentages of children in immigrant families with parents originating from Africa, among states with available data: 35%, 27% and 25% in 2022, respectively. These three states have been home to the largest shares of this population since 2015.
Two of these states — Minnesota and Ohio — also experienced the most growth in shares of this population since the mid 2000s, followed by Kentucky and Iowa:
- Minnesota: from 17% in 2005 to 35% in 2022
- Ohio: 15% to 27%
- Kentucky: 8% to 19%
- Iowa: 6% to 17%
Parent region of origin: Europe
In 2022, the greatest shares of kids of immigrants with parents from originating Europe were in Connecticut (19%), Illinois (16%) and South Carolina (16%). While state figures on this measure vary from year to year, Connecticut consistently has among the highest percentages in the country.
Although this population has not grown as a percentage nationwide over the last 17 years, it has shifted within the country, with Rhode Island, Kentucky, Pennsylvania and Connecticut each seeing decreases of at least 10 percentage points. No single state saw a large jump in this timeframe, but the biggest increase occurred in Hawaii, with a 3‑percentage point bump from 4% in 2005 to 7% in 2022.
How many children in immigrant families are U.S. citizens?
In 2022, 89% of children in immigrant families were U.S. citizens, an increase from 84% in 2005. This is consistent with the Census Bureau’s finding that the vast majority (nearly 90%) of children of immigrants are born in the United States.
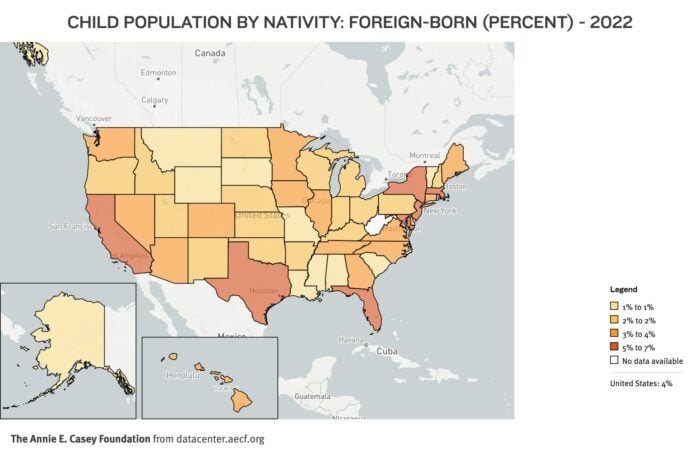
How many U.S. children, overall, are foreign-born?
Among all children (not just those in immigrant families), about 2.6 million, or 4%, were born in another country, according to 2022 data. This figure has hovered at 3% or 4% since the KIDS COUNT Data Center began tracking it in 2005. These kids may be U.S. citizens by naturalization or not citizens. As noted, children who are not U.S. citizens may lawful permanent residents, those with visas, refugees and asylum seekers or undocumented immigrants.
How many children in immigrant families do not have parents who are U.S. citizens (i.e., neither parent at home is a citizen)?
An estimated 35% of children in immigrant families did not have resident parents who were U.S. citizens in 2022 — a figure that has declined from 42% over the past.
How many children of immigrants have parents who recently came to the United States?
Nationwide, only 3% of kids in immigrant families (about 600,000 in 2022) live with parents who have been in the country five years or less. In other words, nearly all children in immigrant families do not have resident parents who are new to the United States. This figure has remained steady at 3% or 4% since 2005. At the state level in 2022, this figure ranged from just 1% in Nevada up to 6% in Ohio and 7% in Mississippi, among states with data.
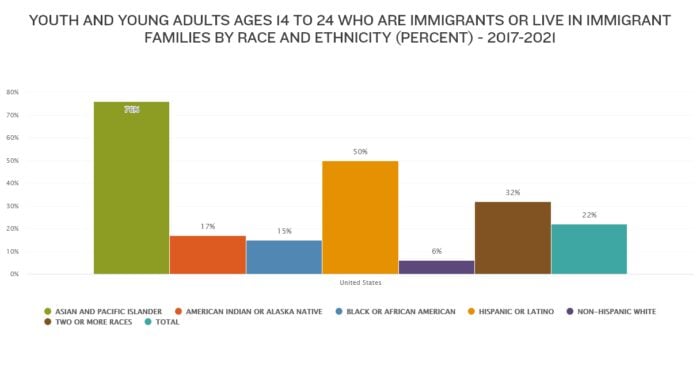
Among young people, what share of each racial and ethnic group are first- or second-generation immigrants?
Nationally, about 75% of Asian and Pacific Islander youth and young adults ages 14 to 24 were immigrants or lived in immigrant families in 2017–2021. The same was true for 50% of Latinos and 32% among those of two or more races, followed by 17% of American Indian or Alaska Native, 15% of Black and 6% of white youth.
Among states with data in 2017–2021, the share of young people in each racial and ethnic group who were first- or second-generation immigrants varied widely:
- Asian and Pacific Islander youth and young adults: New Jersey had the highest share of immigrants or those in immigrant families, at 84%, while Hawaii had the lowest, at 47%.
- Latino youth and young adults: State shares ranged from a high of 64% in Maryland to a low of 14% in Montana.
- Two or more races: Montana had the smallest percentage (4%) of these youth ages 14 to 24 in immigrant households, while Florida (47%) had the largest.
- American Indian or Alaska Native youth and young adults: In New York, nearly half (47%) of these young people were immigrants or in immigrant families, while the share in Wyoming was less than 1%.
- Black youth and young adults: Minnesota had the highest share in the country, at 54% in immigrant households, while Arkansas and Mississippi had the lowest, at 1%.
- White youth and young adults: State figures ranged from highs of 15% in California and New Jersey to lows of 1% in Arkansas, Mississippi and West Virginia.
Income and Employment Statistics for Children and Youth in Immigrant Families
Economic stability provides a critical foundation for healthy child development. When parents are unemployed or earn low wages, their ability to meet basic needs and access resources to support their kids is limited, which can undermine their children’s well-being and prospects in school and beyond. Economic hardship can also disrupt children’s cognitive development and physical and mental health. These impacts reverberate across the lifespan. Children in immigrant families generally have disparate access to resources and face greater hurdles to economic stability compared to children in non-immigrant families.
How many youth in immigrant households live in high-poverty areas?
One in 10 (10%) of these young people ages 14 to 24 lived in high-poverty areas in 2018–2022, down from 20% in 2009–2013. “High-poverty areas” refer to census tracts with poverty rates of 30% or more. At the state level, this figure was as low as 2% in New Hampshire and as high as 22% in New Mexico in 2018–2022.
What share of young people in immigrant families live in low-income households?
About 2 in 5 (39%) youth and young adults who were immigrants or resided with immigrant parents lived in low-income households in 2018–2022. Among states with available data, this figure ranged from a low of 25% in New Hampshire up to 55% in Mississippie.
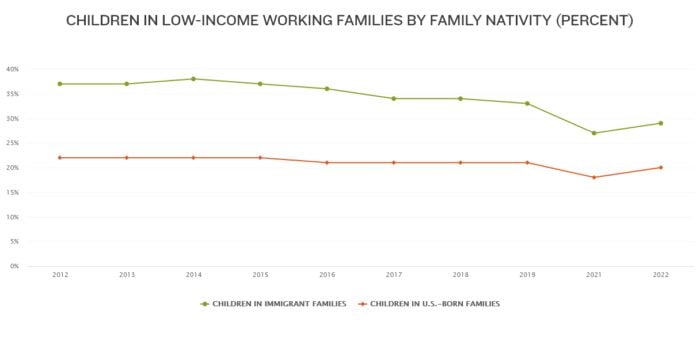
How likely are children in immigrant families to live in low-income working households?
In 2022: 29% of kids in immigrant families were living in low-income working households compared to 20% of kids in U.S.-born families. The difference between these two groups has narrowed over the last decade. While the share of children in low-income working families increased by two percentage points for both groups from 2021 to 2022, the figure for children in immigrant families is lower now than it was during the previous decade, when it stayed above 30%.
How many children in immigrant families have parents who lack secure employment?
About 4.2 million, or nearly one in four, kids in immigrant families live in households where no parent has regular, full-time employment, according to 2022 data. This figure steadily fell over the past decade from 28% in 2012 to 21% in 2019, and then jumped to 27% in 2021 before dropping back down to 23% in 2022. Among states with data in 2022, this statistic varied widely, from less than one in ten (8%) kids in South Dakota to nearly one in three (30%) in Louisiana.
What is the median income for immigrant and non-immigrant families with kids?
The median income for immigrant families with children was $81,900 in 2022, compared to $90,400 for U.S.-born families with children. Households with children in immigrant families consistently have had lower median incomes in recent decades, although incomes substantially increased for both household types since 2012, and the gap has narrowed.
Housing Statistics for Children in Immigrant Families
Safe, stable and affordable housing is critical for child health and well-being. Stable housing roots children, young people and families in communities, enabling them to access opportunities, build social networks and have consistent education and neighborhood experiences, all of which provide an important foundation to thrive. Housing stability is linked to many positive outcomes for children and families, including better educational achievement, employment stability and physical and mental health.
Unfortunately, kids in immigrant families are more likely to experience housing instability than their peers in non-immigrant families. Obtaining affordable housing is a particular challenge. When families have to pay too much for rent or a mortgage, it limits their capacity to afford other necessities, such as food, health care, transportation and child care. Unaffordable housing can also lead to other risks such as foreclosures and evictions, families moving in with others (crowded housing), moving to less safe conditions or homelessness.
How does the ability to afford housing compare between kids born to immigrant families and kids in U.S.-born families?
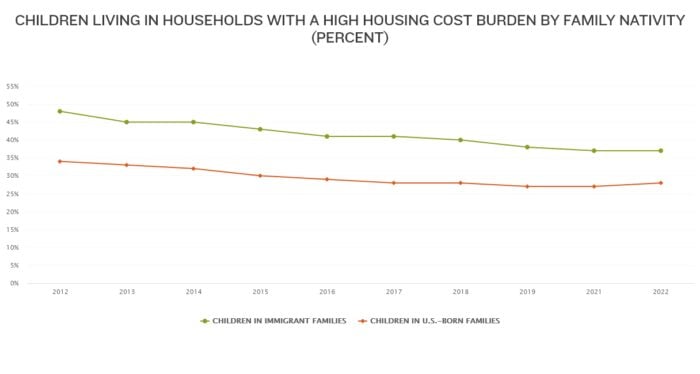
In 2022, 37% of children in immigrant families were living in households with a high housing cost burden (i.e., more than 30% of monthly income spent on housing) versus 28% of children in U.S.-born families. While housing cost burdens have declined for both groups since 2012, this disparity has persisted since 2000–2002, the earliest years of data availability.
How does home ownership compare for immigrant and non-immigrant families with children?
In 2022, children in U.S.-born families were more likely to live in households that owned their homes (68%) compared to children in immigrant families (58%). This home ownership disparity between immigrant and non-immigrant families has persisted for two decades.
Why does home ownership matter?
Experts argue that increasing affordable home ownership, in addition to affordable rental housing, is a critical way to improve housing stability and affordability for vulnerable families. Major advantages to home ownership include stable or declining housing costs over time (with a fixed-rate mortgage) compared to rental costs that typically increase over time, as well as the ability to build wealth through home equity. A home owner’s mortgage payment each month can be seen as an investment in an asset, whereas each rent payment is an expense. An analysis by the Urban Institute also found that low-income home owners were actually less burdened by housing costs than low-income renters. Recognizing the challenges that immigrant families face in obtaining stable housing, leaders can pursue strategies to expand affordable home ownership for this population and low-income families in general.
What share of children in immigrant families live in crowded housing compared to children in non-immigrant families?
Children in immigrant families are close to three times more likely to live in crowded housing (defined as more than one person per room, including living rooms, dining rooms, etc.). In 2022, 26% of kids in immigrant families lived in crowded housing, an improvement from 36% in 2000–2002. In these same years, however, just 9% or 10% of children in U.S.-born families were living in crowded housing. Overcrowding, specifically, is linked to negative social, educational, physical and mental health outcomes for children.
Education and Language Statistics for Children in Immigrant Families
Promoting educational achievement requires ongoing quality education, learning environments and support from early childhood through young adulthood. Many children in immigrant families face greater hurdles to educational success than children in non-immigrant families. The education and language indicators provided below — as well as our country’s persistent academic disparities by race, income and English proficiency — demonstrate the need for additional efforts to provide equitable opportunities for success. Leaders can prioritize the needs of these children, support their strengths like bilingualism, and reduce barriers to achievement.
How likely are children in immigrant families to have no parent at home with a high school diploma or equivalent?
Nearly one in five (18%) children in immigrant families had no parent with a high school diploma in 2022, a decrease from 29% in 2000–2002. This same statistic is much lower among children in U.S.-born families and declined from 9% to 5% over the same two decades.
What percentage of children in immigrant families live in linguistically isolated households?
In 2022, 16% of children in immigrant families lived in linguistically isolated households, a figure that has dropped by 12 percentage points since reaching 28% in the early 2000s. States with the greatest shares in 2022 were Louisiana (26%), Tennessee (24%) and Kentucky (21%), among those with available data. (Note: A linguistically isolated household is one in which no person age 14 or older speaks only English, and no person age 14 or older who speaks English as a second language speaks it very well.)
How likely are fourth-grade English language learners to score below proficient in reading?
Nationwide, 90% of fourth graders who are English language learners scored below proficient in reading in 2022. By comparison: 64% of their English-fluent classmates did not achieve reading proficiency that year.
U.S. Child Population Growth
The overall U.S. child population has decreased in size in recent decades, according to a recent report commissioned by the Annie E. Casey Foundation. At the same time, the population size of children in immigrant families has increased, as noted above, contributing to the growing diversity of America’s children. A declining U.S. child population means a future decrease in the workforce which, in turn, places greater importance on kids’ health and educational outcomes so that they can become viable workers. The shrinking child population not only elevates the importance of each child to our country’s future prosperity, it also elevates the role of immigrants as a source of population and economic growth.
For all children to thrive, the basic needs of every young person — from every demographic group — must be met. The increasing racial, ethnic and linguistic diversity of U.S. children means that leaders must invest in culturally responsive strategies to support the well-being of young people. The Foundation urges policymakers and other leaders to prioritize policies and programs that would expand opportunities for America’s children, youth and young adults in immigrant families, along with other vulnerable groups that consistently face barriers to success.
Learn More About Children of Immigrants
The Annie E. Casey Foundation offers a range of reports and resources to promote the health and well-being of children and families, including the immigrant population. Explore the resources below and sign up for our newsletters to continue learning.
- See all data by family nativity on the KIDS COUNT Data Center
- Report: Race for Results: Building a Pathway to Opportunity for All Children (2024)
- Report: Roadblocks to Workforce Inclusion for Young Adult Immigrants (2022)
- Resource Roundup: Supporting English Language Learners (2022)
Additional resources from the Migration Policy Institute: